Musical Chord Waveform Visualizer


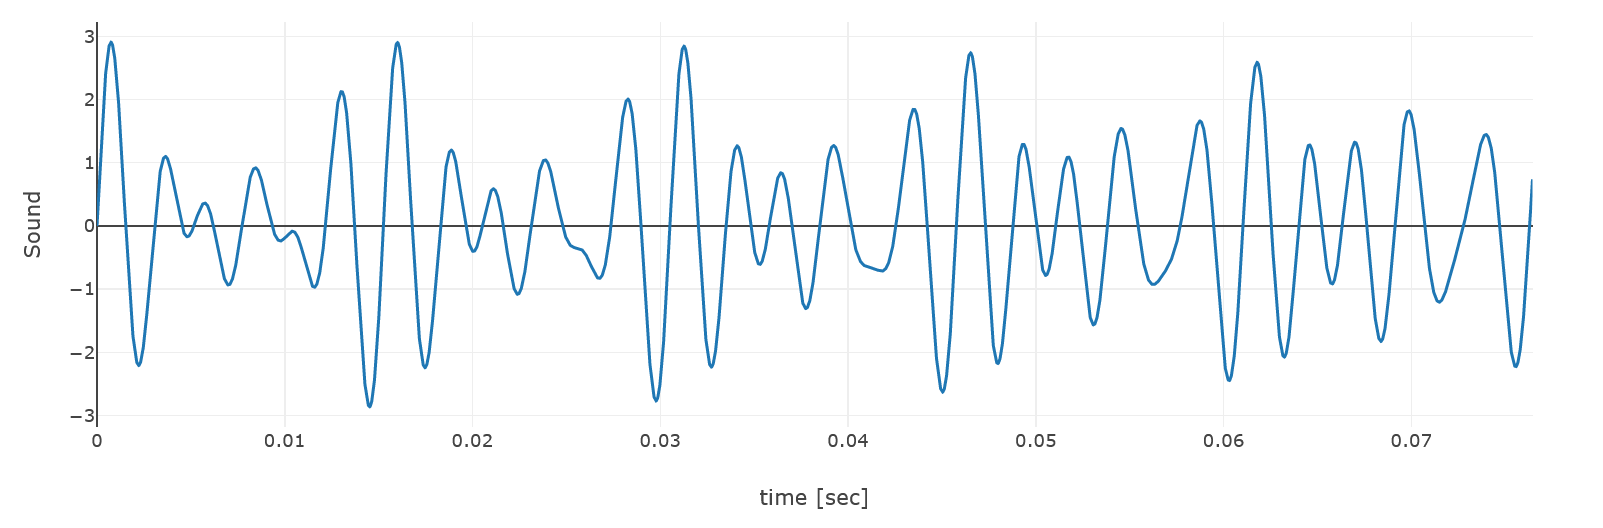
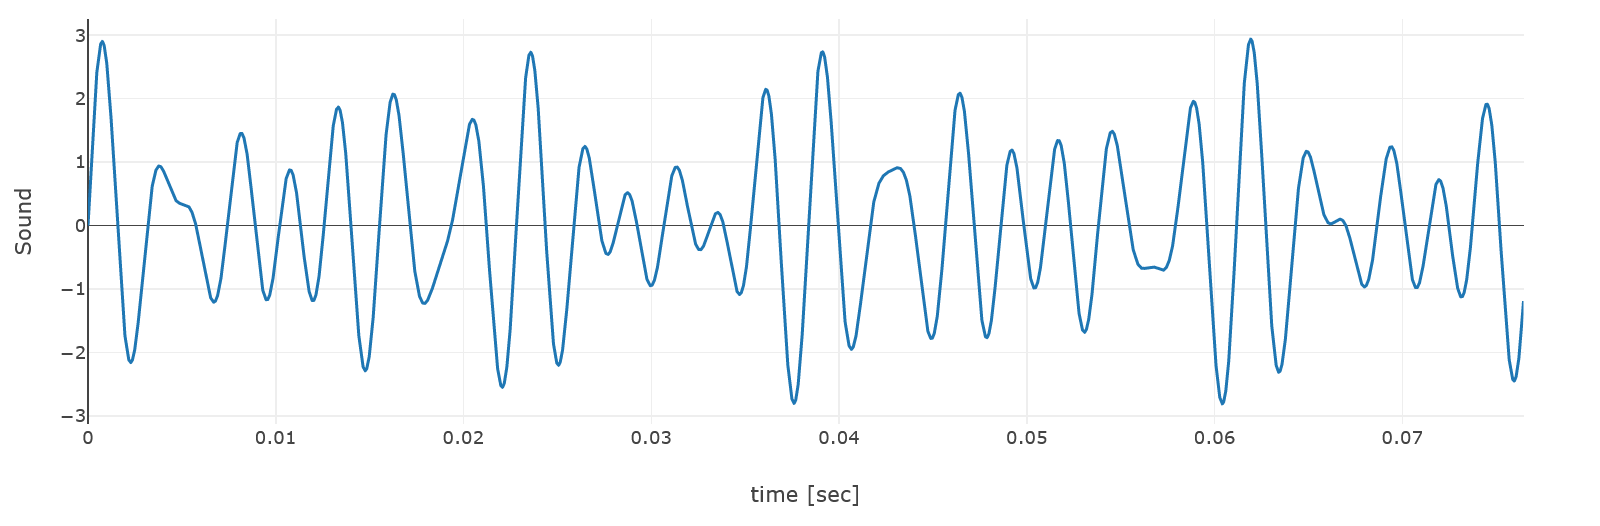
The EngineeringPaper.xyz sheet below visualizes the waveform generated by various combinations of up to three musical nodes that can be selected by the user. Various combinations of musical notes combine in complex and interesting ways to create the sound combinations that we recognize as chords. For example, you can see the different between a C-Major and a C-Minor chord below:
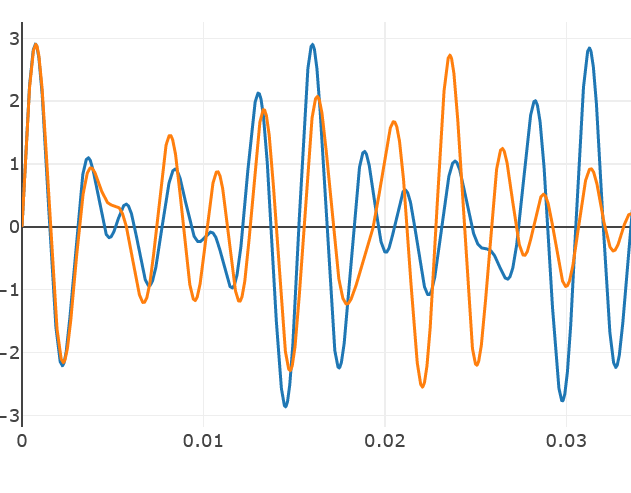
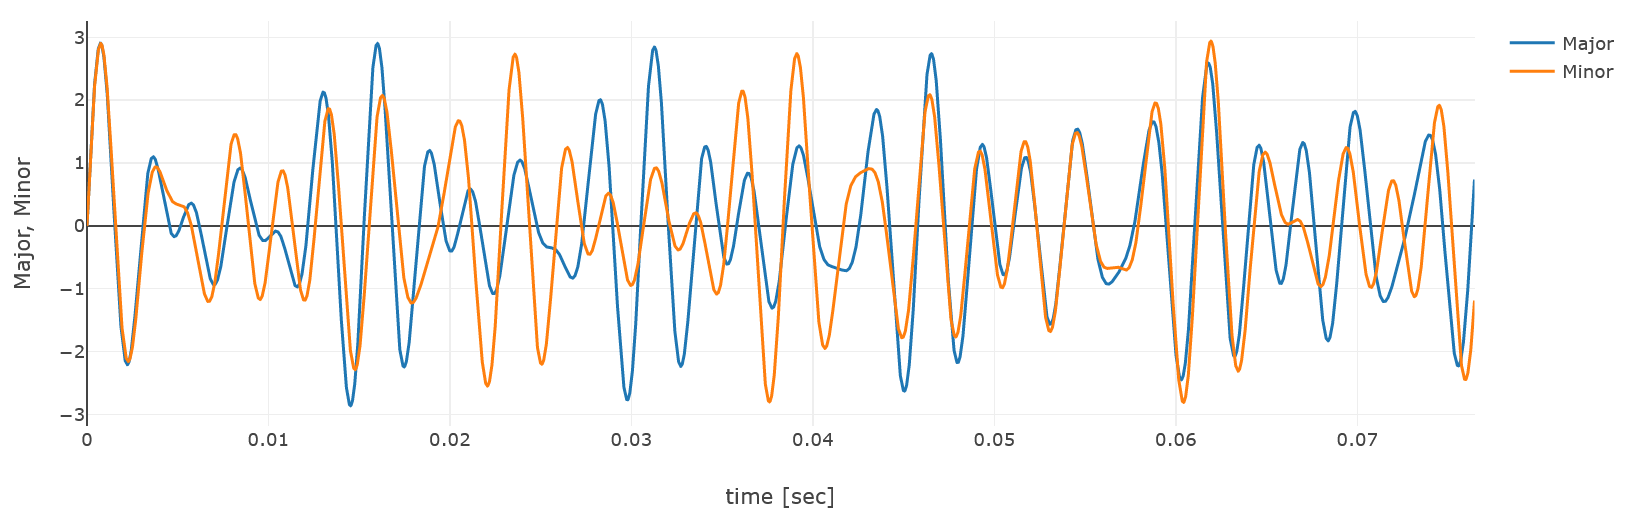
We can also look at both chords plotted on the same graph:
Try out other combinations of notes in the interactive chord visualizer below.
This musical chord visualizer may also be opened in a separate tab.
Musical Chord Waveform Visualizer
by u/mgreminger in EngineeringPaperXYZ